
CUET 2026 Score Normalization: How NTA Calculates Percentiles
Table of Contents

The Common University Entrance Test (CUET) opens up opportunities for students to be admitted to Central Universities in India at the undergraduate level. With thousands taking CUET over many days and hours, it is important that all applicants understand how the National Testing Agency (NTA) calculates percentiles and how they are going to normalise scores so as to ensure everyone has a fair chance of getting in. A Full Overview of the CUET Normalisation Process, as well as a Method for Calculating Your Percentile and the Meaning of Your CUET Admissions 2026.
What is CUET Score Normalization?
Through statistical methods that the National Testing Agency employs to adjust for different question papers and the difficulty levels of each test for fairness in multiple shift testing, CUET is normalised. CUET scores will be adjusted to allow for an accurate comparison of test results between the different shift times taken by students.
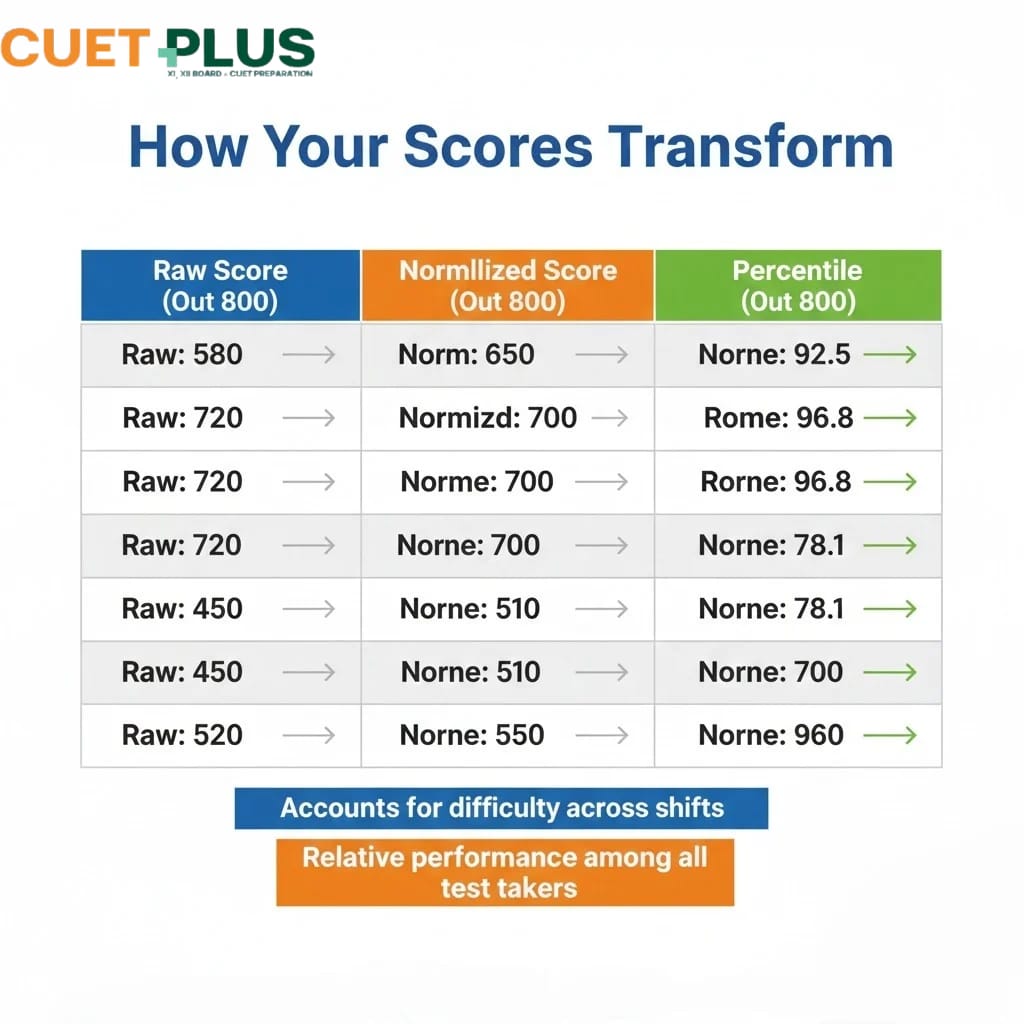
Your raw CUET score will be adjusted to provide you with a normalised score that will be used for the purpose of calculating your percentile. Your percentile is what gives you your rank and ultimately affects your chances for admission into the school and program of your choice.
Key Points About CUET Score Normalization:
- When an examination is administered in multiple shifts, this form of evaluation would be applied.
- Exam difficulty levels can vary for each examination “shift,” and as such, all exam results should account for this factor.
- Students should not be given an unfair advantage or disadvantage based on their assigned shift.
- The methodology used to develop the percentile scores for CUET is based on established and widely accepted statistical techniques.
- CUET percentile scores are calculated using normalized or converted marks.
At CuetPlus, we provide a wealth of resources and tools that help students understand these elements and provide support for successful preparation for CUET and the college admissions process.

Why Does NTA Use Score Normalization for CUET?
Due to the enormous number of students taking the CUET, the National Testing Agency conducts testing on several different days and shifts with different question papers for each shift. Therefore, while attempts at rigorous pre-testing and validation have been made, the sheer volume of students tested means absolute uniformity of difficulty levels across shifts is not feasible.
Primary Reasons for CUET Score Normalization:
Variations in Difficulty Level: Even when care is taken during paper-setting, the difficulty level of one shift’s paper may be slightly more or less challenging than another shift’s paper. Thus, all such variations across the board are unavoidable and can be accounted for through the Normalization process.
Equal Opportunity in Competition: All CUET candidates sitting in different shifts are vying for the same place(s) at the universities they have applied to. As such, all candidates who take their test during a more challenging shift are provided with an opportunity to compete at an equal level with their counterparts taking tests in a less difficult shift.
Logistical Feasibility to Conduct CUET as a Large-Scale Examination: The CUET has become one of the largest entrance examinations in India. Logistically, conducting it over several shifts is the only method by which to provide an equitable opportunity for all students to take part in this examination process. The Normalization process assures that this multi-shift technique will be conducted fairly and credibly.
Statistical Validity of the Normalization Process: The Normalization methodology follows well-established Psychometric Principles of Statistical Testing that are used throughout the world. Therefore, the Percentile Score generated using the CUET normalization process is a valid statistical calculation that can be defended.
Having an understanding of these concepts will assist CUET candidates in understanding why his/her raw marks may not match the normalized percentage calculated by CUETPlus. The CuetPlus platform will provide a detailed description of how these calculations were performed and how to best prepare for the CUET.
Understanding the CUET Percentile System
Before getting into the normalization calculation, first, it’s important to understand the meaning of CUET percentiles for you; CUET percentiles indicate the proportion of candidates whose scores were equal to (or lower than your normalized score.
Interpreting the CUET Percentile Scale:
- CUET percentiles will show that you scored higher than 90% of all examinees
- The CUET percentile scale uses a 0-100.0 scale
- CUET percentiles are represented by four significant digits (e.g., 95.4567)
- The higher the CUET percentile, the better the performance
- Individual papers have separate CUET Percentile scores for each subject
Important Distinction: Note that your CUET marks are not the same as your CUET percentile. For example, if you receive a score of 180 out of 200 raw marks, you will not be guaranteed a CUET percentile of 90; this is dependent on the performance of all candidates on the same test across all shifts.
This is what makes it possible for CUET scores to be comparable over multiple years; even though test paper difficulties can vary by year, universities will be using the CUET percentile scores for both the preparation of their merit lists and the selection process for counseling.
The NTA Normalization Formula Explained
CUET scores are normalized using equi-percentile equating. This procedure uses an established method of normalizing any given score so that whichever shift you are in has the same distribution of scores. All shifts need to be converted to a common score distribution before determining what scores fall into each category/equivalent percentile.
The Core CUET Normalization Formula:
Normalized Score = (M_jq – M_iq) × (S_gt / S_jq) + M_gt
Where:
| Variable | Definition |
| M_jq | Mean score of candidates in the current shift (the shift for which normalization is being done) |
| M_iq | Candidate’s raw score in the current shift |
| M_gt | Mean score of candidates in the base shift (typically the shift with highest number of candidates) |
| S_gt | Standard deviation of scores in the base shift |
| S_jq | Standard deviation of scores in the current shift |
For simpler understanding:
The equitable equating procedure adjusts your score based on how you did in comparison to others in your shift. From there, your score is scaled back to the distribution of the base shift. Therefore, if your shift was more difficult to take and had an average score that was lower than the average score for the base shift, your score would be adjusted upward from your actual score. On the contrary, if the average score was higher than the average base shift score, then your score would be adjusted downward.
Therefore, it is possible for someone who scored 150 in a difficult shift to end up with a higher-normalised score than someone who scored 155 in an easier shift. This makes it possible for all participants to compete fairly against each other.
Step-by-Step CUET Percentile Calculation Process
Once normalization has been achieved, the NTA will generate and calculate a percentile ranking for each candidate. The NTA will outline how the percentile rank was generated in the following manner:
Step 1: Compilation of Raw Scores
- The NTA collects the raw scores of the candidates who appeared for the examination during the various shifts.
- The NTA verifies the raw scores of each of the candidates and resolves any errors found in the raw scores.
- After all errors are resolved, the data for the raw scores are sorted by shift for normalisation purposes.
Step 2: Application of Normalisation
- The NTA will apply the equipercentile method to each of the shifts.
- The shift with the highest candidate count is the base shift.
- After the base shift has been determined, the NTA will perform a calculation of the normalised scores using the equipercentile method.
- Finally, the NTA conducts a review of the results to ensure that no error has occurred during the calculation of the normalised scores.
Step 3: Calculating Percentiles
Using the normalised scores calculated in Step 2, the NTA will calculate the percentiles for each candidate using the following formula:
Percentile = [(Number of candidates with normalized score ≤ your score) / Total number of candidates] x 100.
Step 4: Resolving Ties
In the cases where two or more candidates have the same normalised score, the NTA will apply the following methods to break ties:
- The tied candidates will have the same percentile.
- Use of tie-breaking criteria (age and performance on each subject) to determine the rank order of the tied candidates.
Step 5: Percentile by Subject
- The NTA calculates separate percentiles for candidates for each subject of the CUET.
- The NTA also calculates the percentiles for candidates for the Domain subjects, Languages, and General Test independently of each other.
- The NTA does not publish composite percentiles for the CUET.
Step 6: Declaration of Results
- Results: Final CUET percentiles will be posted on the candidate’s login
- Scorecards indicate both the candidate’s normalized score and their percentile rank versus others across all shifts taken for that given subject
- Candidates will receive a CUET subject normalized percentage of all students who completed the CUET to enable admission decisions by University Admissions Officers
The whole CUET percentile calculation process is run automatically and has multiple validation checks for accuracy. To aid in estimating the possible percentile rankings for the upcoming CUET, you can use the CUET Percentile Calculator Tool that has been developed to help students estimate their likely percentile based on what their raw marks would be in the upcoming CUET and how they compare to CUET data trends from the previous year.
Real Examples of CUET Score Normalization
The CUET score normalization process is best understood through examples. Below, we will show you step by step how it works using realistic but hypothetical scenarios:
Example 1: Basic Normalization Scenario
Considerthe Physics paper conducted in two shifts:
| Parameter | Shift 1 (Base) | Shift 2 |
| Candidate’s Raw Score | 160 | 155 |
| Mean Score (M) | 140 | 132 |
| Standard Deviation (S) | 25 | 22 |
For the Shift 2 candidate, normalized score calculation:
Normalized Score = [(155 – 132) × (25/22)] + 140
= [23 × 1.136] + 140
= 26.13 + 140
= 166.13
Result: The candidate who has scored 155 raw marks in Shift #2 receives a Normalized score of 166.13, thus receiving a Normalized Score higher than the candidate who scored 160 in Shift #1 due to the increased difficulty level of Shift #2. Thus, we can see how CUET Normalization enables equitable scoring for all candidates.
Example 2: Impact of Difficulty Level
Three candidatesare appearing in different shifts of the English paper:
| Candidate | Shift | Raw Score | Mean Score | Std Dev | Normalized Score |
| A | 1 (Base) | 175 | 155 | 28 | 175.00 |
| B | 2 (Easier) | 178 | 165 | 24 | 170.67 |
| C | 3 (Harder) | 172 | 148 | 26 | 180.07 |
Analysis: Because Candidate C performed at the top level for the Shift they competed in (Shift #4) and had the lowest number of raw marks (172), Candidate C received the highest normalized score of (180.07). Candidate C demonstrates how CUET Normalization makes Equitable Scoring Possible.
Example 3: Percentile Calculation
If we hypothetically consider that 45,000 students took the CUET in our hypothetical subject after normalisation:
- A student (let’s call them Student X) received a Normalised Score of 165.
- Num of students scoring ≤165: 40,500.
To calculate their Percentile = (40,500/45,000)×100 = 90.00 percentile.
The percentile of Student X’s CUET Score of 90 is representative of their performance when compared to everyone else who took the same exam across all shifts (as well as all shifts).
These examples illustrate how important it is to have a thorough understanding of the CUET score normalization process; the raw CUET marks represent only one aspect of your performance on the exam, while the normalized score and percentile results ultimately matter for admission.
How Normalization Affects Your CUET Marks
The CUET Score Normalization Process can affect your final standing greatly, and in some cases,s in completely unexpected ways. By understanding these factors, you can develop more realistic expectations and create a more effective strategy.
Positive Effects of Normalization Include:
1) Fair shift allocation: The NTA’s (National Testing Agency) CUET marks normalization process will adjust for any differences between different shifts. Therefore, if you receive a shift with a difficult paper, you will not be penalized; instead, this will be factored into the normalization process.
2) Consistent competition: All candidates who take the exam in different shifts will be competing on an equal footing, regardless of when they take the test. Consequently, the calculation of CUET percentiles is based solely on merit.
3) Reduced anxiety: Knowing that there are some variances in difficulty levels and knowing how those variances are accounted for can alleviate some of the anxiety about whether one will receive a “difficult” shift.
Negative Effects of Normalization Can Include:
1) Score reductions: If you took the test in an easier shift and received the same score as the average for your shift, your normalized score may be less than your raw score.
2) Unpredictable final scores: Without knowing the total number of candidates who took the test in your shift and their statistics, it is impossible to accurately predict your final normalized scorbeforeto the announcement of results.
3) Complexities: Technical complexities surrounding normalization can cause confusion for students who expect a direct relationship between percentile and raw marks.
Strategic Considerations:
Concentrate on your absolute performance instead of worrying about how difficult the shift was. The normalization process will ensure that fairness is taken into account by automatically adjusting scores for difficulty level. Perform as well as you can on the actual CUET marks and ignore perceived difficulty levels of the paper when applying to universities; instead, use direct applications through tools such as CuetPlus College Predictor to see what range of percentile translates into your chance of being admitted to different institutions.
Common Misconceptions About CUET Percentiles
There are many misconceptions regarding the CUET score normalization and percentile calculations. The following myths about CUET score normalization and percentile calculation must be cleared up:
Misconception 1: “Normalization Always Increases Your Score.”
Fact: Normalization adjusts your score based on how well you did relative to the difficulty of the test. Therefore, if you took an easier shift, your normalised score is likely to be lower than your raw score.
Misconception 2: “The Raw Score Determines the Percentile.”
Fact: The CUET percentile is based on the normalised score and how you performed compared to all candidates, not just the raw score you received.
Misconception 3: “Every Subject Has One Normalisation Method.”
Fact: Each subject is separately normalised. The normalisation of Physics is not the same as the normalisation of English or Political Science.
Misconception Four: “Negative Marking Will Not Be Included in the Normalization Process.”
Fact: Negative marking has already been factored out of your raw score (the final score you receive). Therefore, after your final raw score is received, normalization will be based on these final raw scores.
Misconception Five: “I Will Be Able to Determine Exactly What My Percentile Is Prior to the Results Being Released.”
Fact: It is impossible to be able to calculate your exact percentile prior to results being released without knowing the mean and standard deviation for your shift, as well as all other shifts. However, you can make reasonable approximations of your percentile using the CuetPlus percentile estimator, which allows you to use historical trends for reference purposes.
Misconception Six: “Universities Do Not Use Normalized Scores When Making Admission Decisions.”
Fact: The National Testing Agency (NTA) provides only the normalized scores and percentiles for each applicant to universities. Raw scores are not provided in the data sent to universities.
By understanding these realities regarding the normalization process for CUET scores, candidates can better manage their expectations and plan for college accordingly.
Tips to Maximize Your CUET Normalized Score
While it is not possible for candidates to control the normalization process, candidates can develop strategies to help maximize their performance on the CUET, which will subsequently help maximize their CUET percentile:
Pre-Exam Preparation:
Become proficient in time management: If you practice completing full-length papers under time constraints, your accuracy will also improve, even if you face a challenging paper because of good time management skills.
Focus on Accuracy: You should also place a great emphasis on maintaining accuracy by attempting as many questions as possible for the exam; while this will result in more mistakes, the normalization process will have factored in the shift difficulty level, therefore, attempting as many questions as possible will yield a more favourable/raw score.
Know Negative Points: CUET uses a “negative marking” (for incorrect answers) system. Don’t guess on the exam if you don’t have a good idea of what the correct answer could be; otherwise, you’re probably going to get the wrong answer.
Build Concept Understanding: You need a strong conceptual understanding of the material to answer questions right from anywhere, even if the examination questions vary significantly in difficulty. Preparation on surface-level material alone will not allow you pass difficult exams.
During the Exam:
Do Not Become Frustrated: If you find your original exam is extremely difficult to answer, remember that your paper will be normalised by your peers, who will have similar difficulties. Gad Zeller Hobbies
Selective Approach to Questions: If you’re familiar with a subject/topic in which you excel, start there to build up your confidence and gain some marks on those questions.
Check Work: When you’ve completed your exam, use any extra time to recheck marked answers to help prevent mistakes that could cost you valuable CUET points.
After the Exam:
Make Use of CUET Strategy Tool: Once you have your CUET results, use the CUET analysis tool to create reports that will help you determine how well you’ve performed and the areas needing improvement to build a successful councillor strategy.
Become Familiar with College Criteria: Most colleges use different levels of weighting depending on your CUET percentile scores to determine your course eligibility. Use CUET College Predictors to identify colleges that will best match your score profile.
Plan for Counselling: Using your CUET Percentile scores, develop a Plan of Action of University-Course Combos.
Remember that although normalisation ensures each candidate receives an equalisation grade, it is the quality of your primary preparation and results that affects your success. In general, better preparation for your CUET exam will lead to higher Normalised Scores.
Frequently Asked Questions About CUET Score Normalization
Do NTA average scores for all CUET subjects?
Yes, the NTA uses score normalization for all CUET Subjects, including domain subjects, languages, andthe General Test, and for multiple shifts, the NTA normalizes each subject independently of each other.
Is it possible for my normalized score to be less than my raw CUET Score?
Yes. If you sat an easier shift of the CUET where the majority of the candidates scored high, then your normalized score can be adjusted downwards compared to your raw CUET Score.
How accurate are online CUET Percentile Calculators?
Online CUET Percentile Calculators, including that of CUET Plus, are a rough guide to provide you with a ballpark estimate of where you fall in relation to previous years’ data and predictive statistical models. These calculators are not the most accurate once NTA releases the official results.
Are raw or normalized CUET Scores sent to the University?
Universities receive only normalized CUET Scores and CUET Percentiles from NTA. Raw CUET Scores do not get shared as part of the official admission results.
What happens if two candidates have the same CUET percentile?
In the situation where two candidates have the same CUET Percentile, NTA will utilize Tie-Breaking rules based on Age, Individual Subject Performance to assign a Relative Rank to the candidates during Counseling.
How does CUET score normalization compare to international standards?
Yes, the equi-percentile equating method used for calculating CUET percentiles by NTA (the National Testing Agency) is an internationally recognised method of standardising test results based on statistical methodology used to equalise scores on different tests worldwide.
Can I file a challenge against my normalised score if I believe there is a mistake?
NTA allows students to file challenges against computation inaccuracies in their scores following the announcement of the CUET results. However, you will not be allowed to challenge the methodology used for normalising scores since it utilises a recognised statistical protocol.
Plan Your College Journey with CuetPlus
Understanding your CUET score normalisation and percentile calculation is just the beginning of entering a university. CUET percentiles allow you to apply to any of India’s leading central universities, but it is important to make an informed choice regarding which university and course you want to apply for.
CuetPlus is your comprehensive platform for:
- CUET Percentile Calculator: Estimate your likely percentiles based on expected performance
- College Predictor Tool: Discover which universities and courses match your CUET scores
- Detailed Result Analysis: Understand your strengths and improvement areas across subjects
- Admission Updates: Stay informed about counseling schedules, cutoffs, and university-specific requirements
- Expert Guidance: Access resources, tips, and strategies for maximizing your CUET success
The NTA’s process of CUET marks normalisation guarantees that all students receive a fair chance; however, it is ultimately the student who needs to prepare adequately for success. With the right resources and by having a well-planned strategy, you will be able to turn your CUET percentile into an offer of admission to a university and/or course that meets your dreams.
If you are ready to start working on your future, please go to CuetPlus and use the CUET Percentile Calculator to start planning your university admission process. The path to being accepted into a leading central university begins with understanding your scores—and we will assist you throughout your journey to achieve that.