Best CUET College Predictor 2026 – Check Admission Chances | CUETPlus
Table of Contents
Applying to a college after the Common University Entrance Test (CUET) can feel overwhelming when thousands of people are applying to the same schools. You might have trouble seeing how you would stack up against others because the cutoffs change every year, and the trends of who gets admitted are always changing.
Use CUETPlus Best CUET College Predictor 2026 to estimate admission chances, check cutoffs, and find best-fit colleges. Accurate, fast & updated tool.
CUETPlus’s College Predictor for the Class of 2026 serves as an advanced tool that collects data from across all colleges, so that you know how likely it is that you will be accepted, which colleges will be a better fit for you, and what you should do during counselling.
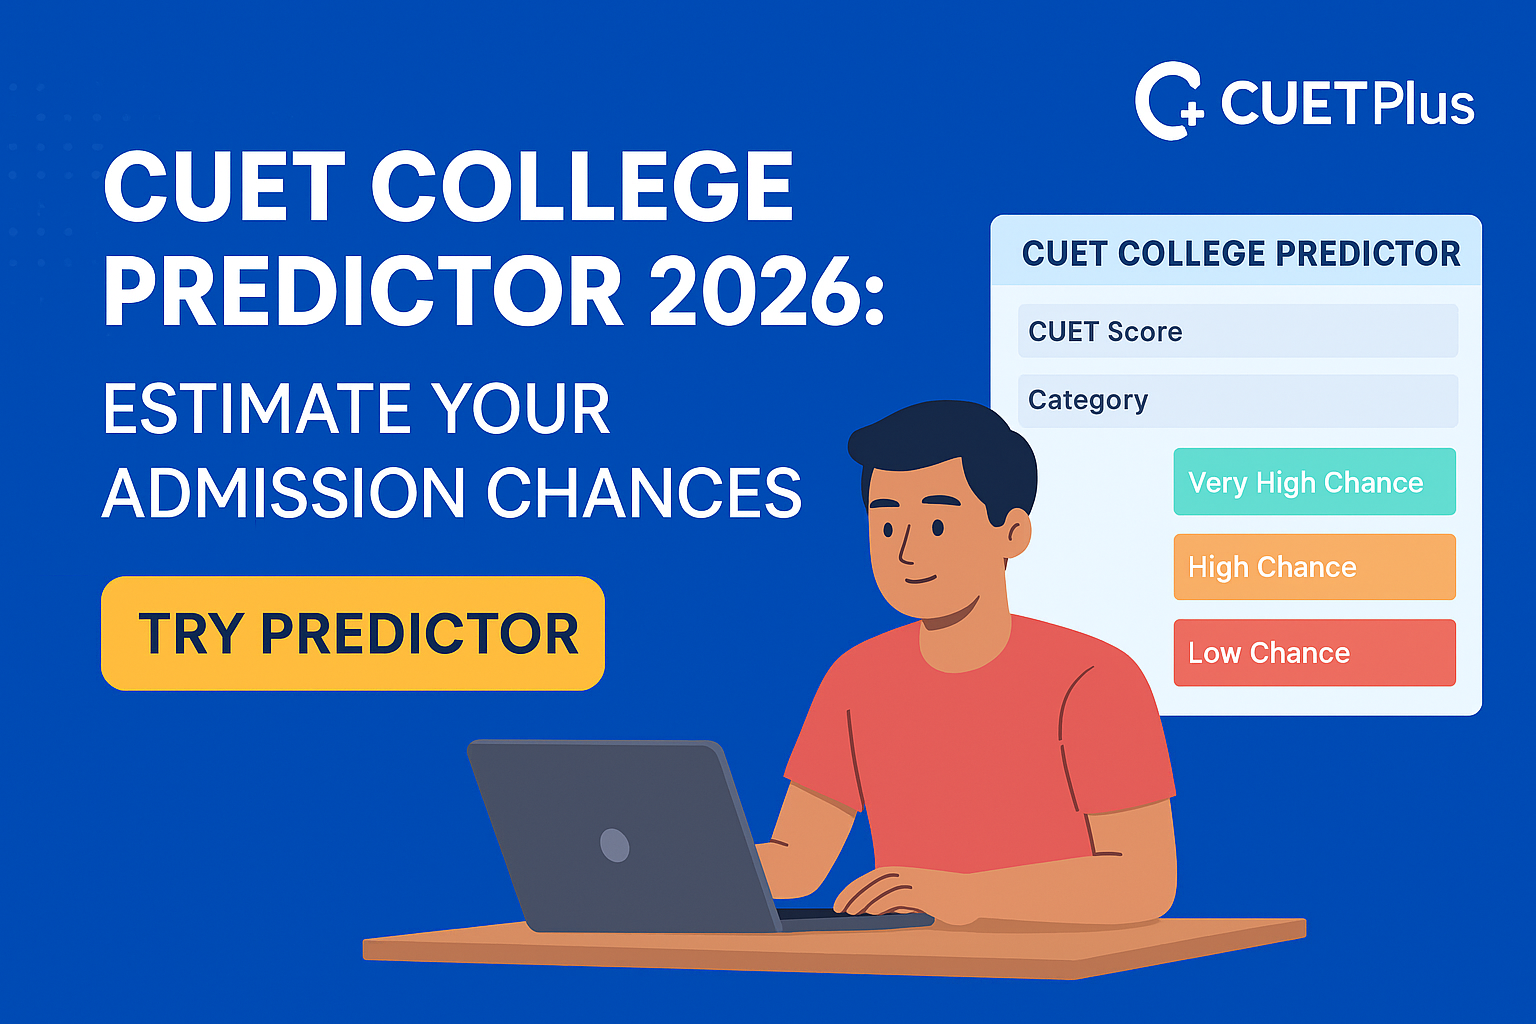
What Is CUET College Predictor 2026?
With the CUET College Predictor 2026, students will have access to this platform to determine:
- What colleges they will qualify for according to their CUET Scores
- Their chance of being admitted into each specific category (General, OBC, SC, ST, and EWS)
- The Course Closures and Estimated Cut Off Ranks
- The list of all of the Universities they will be able to apply to according to their CUET Score
- Ken, Match and Route Colleges that were trending from Last Year
In using only the cutoff data supplied by CUET from 2022 through 2025, the CUETPlus predictor will decrease the confusion caused from results by providing instant results and up to date information on seat trends and prediction logic in real time.
Why Students Use CUET College Predictor 2026
At this phase (after CUET attempt or the release of the CUET answer key), Students are looking for the following:
- Exact admission likelihood
- Shortlist of colleges
- Guidance on cutoffs
- Clarity regarding counselling
- Comparison of Option A to Option B
Therefore, the CUET College Predictor is a tool categorized as BOFU (Bottom of Funnel) as follows:
- Since the student has completed their CUET, they have a strong desire to gain admission
- They have confirmed their wants (to attend college)
- Prior to the student submitting their applications or going through counselling, they want final validation of their information
CUETPlus has optimized its predictor for this very purpose; thus, it produces results with a high level of conversion, high degree of clarity, and fast turnaround time.
CUETPlus Advantage: What Makes This Predictor More Accurate?
The CUETPlus CUET College Predictor 2026 incorporates a four layer prediction process to provide a more accurate prediction.
Layer 1, Historical Cutoff Mining:
- Collect Historical information regarding university cutoffs from DU, BHU, JNU, Allahabad University, JMI, private universities (who use CUET), and both state and central university category wise cutoff statistics.
Layer 2, Trend Analytical:
- The Predictor provides trend analysis on the growth of competition, trends in cutoffs from subject domains, and year over year closing ranks for universities.
Layer 3, Weighted Probability Index (WPI):
- CUETPlus calculates admission probability through the calculation of a student’s Score Weightage plus Trend Weightage plus any Category Boost they have received, all divided by the total number of admitted seats available to the university.
Layer 4, Real Time Adjustments:
- CUETPlus updates as new data is made available to them i.e. provisional answer keys, new normalization patterns, University changes in student intakes, etc.
As a result of the above, CUETPlus provides a More Precise Prediction Than Any Generic College Admission Predictor.
How the CUET College Predictor 2026 Works (Step-by-Step)
CUET College Predictor 2026 Guide — What You Need to Know
when you enter your score into CUETPlus and then receive a list of colleges ranked by probability of admission. I have included information about the information that is used, internal calculations (by CUETPlus)
1) User Inputs – What You Provide (Front End)
The Predictor requires that you submit the cleanest input possible:
- Your Scores would be either raw scores (for example, 420/500) or Normalized Percentile (recommended).
- Your Subject Breakdown would include the subjects for the domain (for example, Physics), and if applicable, Language Scores and General Test Scores.
- Your Category would include your General / OBC / SC / ST / EWS / PWD category, etc.
- (Optional) The Universities or Regions you Prefer would include such Universities as DU, BHU, or preference for ‘All Central Universities’.
- (Optional) The Programs You Prefer would include areas of study such as B.Sc. Computer Science or B.A. Economics.
- (Optional) You can select your Year Range for comparison, including Cutoffs for 2022–2025.
For Mapping Purposes, the three variables of Normalized Score, Category, and Preferred Program create the best possible Match. If You Enter Raw Scores, CUETPlus will Automatically Normalize There Scores Using The Normalization Factors It Has Collected Over Time.
- Input Validation & Automatic Normalisation (Instant Checks)
Before running any predictions, it checks:
(i) That all required fields are populated;
(ii) that any raw scores are converted to a predictor’s normalized CUET Score Scale (if required) utilising recent normalization curves from official distributions; and
(iii) It checks for each user against each input for consistency and flags any that may be inconsistent or may otherwise create an issue (for example, total > maximum possible).
If the user does not choose a category, a warning is provided and it will default to General (with this being clearly noted).
This ensures that the predictor produces results from comparable values that are consistent.
3) Data Retrieval: Historical Cut-Offs and Seat Matrix
The predictor retrieves historical cut-off data (year-to-year, university-wise) and aggregate matrices (the number of programs offered by each university and total number of seats offered for every category of applicant).
- Cut-Offs by University, Program and Year (2022 – 2025).
- The Program Matrix for Each Year – total number of seats offered for each program by category of applicant.
- Year to Year Change Metrics – cut-off and seat increases/decreases as a percentage.
- The Popularity Index of Applicant Programs: how many applicants were accepted historically into each program.
- The Normalization and Domain Difficulties Metadata for Each Year.
All data has been defaulted and tagged prior to startups so that the predictor can request this rapidly from its database.
4.) Score to Rank Estimation will be the Rank Mapping Layer.
If the Ratings Model needs to convert your Normalised Rating to Estimated India’s Rank, it will use its Calibration to Map your Historical Distribution of Rating.
- The Predictor will Build a Score to Rank Curve Based on the Frequency of Ratings in the Historical Database.
- If You Inputted A Percentile from The Score to Rank Curve, It would Map It to the Rank Area Based on What the Predictor Knows Regarding the Current Applicant Base.
You Have Now Received Your Estimated Rank, but it is Not a Requirement for a Tool Focused Solely on Mapping Directly to Cut-off Points.
The process for determining cutoff matches and making trend adjustments is described below:
5) Cutoff Matches & Trend Adjustments
The logic behind making predictions within CUET is routed through core areas of match cutoff patterns:
- Baseline Match: The algorithm will retrieve all recent closing scores of all programs that are applicable to that entry (University + Program + Category).
- Trend Shift: Each cutoff matches the average value for that entry to determine where the cutoff may now lie relative to historical averages. For example: if the average cutoff rise for that program was +6% for the past X years, then CUET will apply that same average to what it believes the new average cutoff will be.
- Seat-Pressure Adjustments: The algorithm will adjust upward in direct correlation to an increase in the number of applications, in order to provide a greater number of opportunities for students to gain admission to those particular programs. Example: If the total number of applications rises from) the total number of available seats for that program has dropped), CUET will adjust the cutoff for that program in direct correlation to how much of a (Seat-Pressure Adjustments/Applications) there is).
- Difficulty Correction: The algorithm also takes into account the increase or decrease in the difficulty of each program over the course of the year. Example: A program may experience higher average cutoffs because of greater difficulty in that area (e.g. Higher average cutoffs due to poor average exam performance for Physics), therefore the adjustment is applied to those particular programs appropriately.
- Final Closing Score/Rank: The combined adjusted cutoff score is the model’s best estimate of that program’s potential closing score/rank for the academic year.
6) Probability/WPI
Score vs. Adjusted Closing score probabilities are calculated in CUET, using a simple and basic equation as follows:
WPI = (S/C) x 100
Where:
S = Normalized Score (or estimated Ranks inverted to scores.), & C = Closing Score Predictions made for BYP’s – meaning the predicted average Cut-Off for each Program & Category. Then we can make the WPI probability bands assignment:
1) High-C Probability: WPI ≥ 95 → 80-95% chance.
2) Moderate-C Probability: 80 ≤ WPI < 95 → 50-80% chance.
3) Low-C Probability: 60 ≤ WPI < 80 → 20-50% chance.
4) Very Low-C Probability: WPI < 60 → <20% chance.
For Example (WPI Calculation):
Your Normalized Score (S) = 720 out of an 800 absolute score.
The Predicted Closing Score (C) = 760.
Therefore, W
7) Output formatting: College buckets + How you fit in
The predictor creates an easy-to-use report that shows:
- Dream/High-chance colleges (the schools most likely to be a match with predictions) with a match percentage probability for you to get into and your final predicted score.
- Match/Moderate-chance colleges.
- Safety/Low-chance colleges.
- A list of programs that fit better with your qualifications than those above.
- A one-line rationalization for why you are being recommended (For example “Predicted closing score of 740 vs. your current score of 720, increasing at 4% per quarter.”)
Confidence levels (High/Medium/Low) are given by the number of data points used to generate each score and the degree of variation across all programs in that category.
8) Customized PDF & Counselling Steps
You can obtain a PDF with:
- All matched colleges and the match percent probabilities
- Suggested preference order for counselling sessions
- Back-up programs recommended and their reasons for recommendation
- Expert Tips automatically generated for you, as well as the option to schedule a profile review with CUETPlus professionals.
9) Current Updates & Rechecking
When Official Clarifications or Predictions are released, the predictor will:
- Automatically rerun user’s saved sessions
- Provide a change log for students to see how they were affected by the clarification.
10) How to Interpret Results — Smart Suggestions
- Consider the prediction as guidance and not as a guarantee.
- Take note of the Confidence Level of a prediction — A program with High Odds (but Low Confidence) may simply indicate a lack of sufficient data on that program.
- Use the predictor to create three different lists of schools (Dream, Match, and Safety).
- If you find multiple programs that have similar percentages of success, consider setting up a review with an academic advisor to prioritize your school choices.
CUET College Predictor 2026 — Score vs College Mapping
| CUET Score Range | Possible Universities | Expected Outcome |
|---|---|---|
| 760–800 | DU North Campus, BHU, JNU | Very High Chance |
| 700–760 | DU South Campus, JMI, Allahabad | High Chance |
| 600–700 | State Universities, Cluster Universities | Moderate Chance |
| 450–600 | Tier-2 Colleges | Low–Moderate |
| <450 | Private CUET Universities | Possible |
Note: Actual cutoff depends on course demand.
Admission Difficulty by Popular Course Type
Courses with High Competition
- BA Psychology
- B.Com(H)
- BA Economics
- BBA
- B.Sc CS
- BA English
To gain admission to the leading central universities, these courses will typically require a score of 750 or higher.
Courses with Moderate Competition
- BA History
- BA Political Science
- B.Sc Maths
- BA Sociology
Typical cutoffs for admission into the above mentioned courses, range from 650 – 720.
Courses with Low Competition
- BA Languages
- B.Sc Home Science
- B.Voc Programs
Typical cutoffs for admission into the above mentioned courses, range from 400 – 600.
The CUETPlus Predictor assigns a weighted score of difficulty to help improve its predictive accuracy.
CUET Cutoff Tool Functionality
The CUETPlus CUET Cutoff Tool is integrated into the CUETPlus CUET Predictor and offers several features to assist users with their predictions:
- Previous Closing Ranks on College Applications
- Yearly Percentage Increases/Decreases or Cutoff
- By Program Comparison – All Programs in each College Ranked
- Rank by College Difficulty – Highest to Lowest
The above information provides students with the rationale behind why a college has the designation of either “Very High Chance” or “Very Low Chance.”
Essentially, CUET College Predictor 2026 will provide students with their estimated all-India rank while CUET College Predictor will advise them of the colleges in which they are likely to gain admission.
As such, the two CUET College Predictor tools provide four ways to assess student likelihood of gaining admission to a college.
Internal Link Suggestion:
Make use of the CUET College Predictor 2026 before utilizing CUET College Predictor. Making use of these two CUET College Predictor tools together will increase accuracy.
Students Make Errors When They Use College Predictors
- Raw Score Entered instead of Normalized Score
- Not Considering Category Reservation
- Assuming DU Cutoffs Remain Constant
- Comparing Different Programme Cutoffs
- Selecting too many Universities
- Not Considering Changes in the Seat Matrix
CUETPlus Automatically Detects Missing Entries and therefore Minimizes Errors.
Best Advice After Using the CUET Plus Predictor
- Three-Bucket List
- Dream Colleges
- Colleges that are a Good Match
- Safety Colleges
- Select at least 2 Alternative Courses
For Example:
If you are applying for Psychology, then:
- Sociology
- Philosophy
- Expert Review with CUETPlus
Experts Help to:
- Correct Your Preference List
- Improve the Order of Your Selections
- Prevent You from Losing a Seat Because of a Wrong Choice
- Review Updated Cutoffs after You Have Normalized Your Scores
Due to Normalization, Your Chance of Getting Admitted May Changing up to 5 – 15%.
- Save All Your Choices in CUETPlus Planner
Having a Saved List of Colleges is Very Useful when Filling in Choices.
How CUETPlus predicts & calculates your chance of admission
(Details on how)
- Score Calibration
Your normalized score adjusted using:
- Subject difficulty
- Website weight
- Bonus for being from a minority category
- Course Elasticity Model
Estimate how many students will apply to each course - Seat-Pressure Index
Calculates demand for every university. - Closing Rank Estimate
Uses regression curves to predict potential cut-offs
- Models of historical trends
- Statistical variance
- Final Probability Score
Expressed in:
- Probability – HIGH (80%-95%).
- Probability – MEDIUM (50%-80%).
- Probability – LOW (20%-50%).
- The Expected CUET Cutoff Balances for 2026
According to the trends for 2022–25, CUETPlus is predicting:
- DU Cut-Offs:
- Very high demand courses to have an increase of 5%-12%
- Average level courses to remain around the same
- Language courses will likely see a small decrease.
- BHU Cut-Offs:
- B.A. Program to go up
- Science will likely remain the same
- B.Com likely to increase
- JMI/JNU School cut-off to possibly rise slightly due to limited seats
- Most other universities have increased the number of seats and are expected to lower cut-offs.
CUETPlus College Predictor – Summary of Features:
Fast and Accurate Predictions, Category-wise Cutoffs, Course Difficulty Rankings, Customized Predictive Reports, Counselling Support Included and Data from more than 200 Universities
How to Use CUET College Predictor 2026
Sample Input: Score 720, Category OBC, University DU, Course BA Eco
Sample Output from CUET Predictor: High Probability of Admission (Zakir Hussain College, Motilal Nehru College), Moderate Probability (Ramanujan College), LowProbability (Kirori Mal College, Hansraj College) – only indicative and not final, used for guidance prior to your admission interview.
Call to Action Section – Use CUET College Predictor 2026 to Find Out Your Exact Admission Chances
Use The 2026 College Predictor on Official CUETPlus Website to get a Fast Prediction, get Results By University, Have A Customized Predictive Report With Counselling Recommendations.
CUET College Predictor 2026
Find Out Your Exact Chances of Admission.
Use the CUETPlus College Predictor 2026 Tool to Determine Where You Stand in the Admissions Process!
- Instantaneous Predictions
- Results by University
- Customized Recommendations for Counseling
Try the CUET College Predictor CUET Result Date 2026, Cutoff & FREE Rank Predictor Tool
Book a Profile Review with CUETPlus Expert Counselors Counselling Assessment – Expert Guidance for Your CUET Journey
FAQ
- What exactly is the CUET College Predictor 2026 and what does it do?
It’s an estimation tool that predicts your chances of getting into different colleges based on your CUET results, category and choice of major.
- How accurate is the CUET College Predictor?
Using CUET cutoffs and seat availability trends from 2022-2025 allows us to make very accurate predictions about what you can expect to see in 2026.
- Do I need to provide my normalized score in order to use the CUET College Predictor?
Absolutely! Your normalized score is used to provide the most accurate prediction of what will happen with your admission process, reducing the possibility of prediction errors.
- Which universities does the CUET College Predictor cover?
The CUET College Predictor covers over 250+ CUET universities in India – including Delhi University, Banaras Hindu University, Jawaharlal Nehru University, Jamia Millia Islamia, Allahabad University, several state and many private CUET universities.
- Is the CUET College Predictor free of charge?
Yes, the basic version is free. The premium version provides a detailed written report with a summary of your other applications and a full review of your academic record.
Conclusion
Using CUET College Predictor 2026 from CUETPlus, you get an actual complete guidance engine that assists you in finding your correct place and guide to your admissions.
- Understanding the student’s real chances of success
- Identifying the best-fit college
- Counselling with confidence
- Preventing the loss of seats
- Knowing how to have back-up options ready.
Through historical cut-offs, trend analysis, and artificial intelligence (AI), CUETPlus provides you with the most accurate, reliable, transparent, and custom-fit predictions.

Start Using CUET College Predictor 2026 For Your Customised Admission Path!
Get a Personalized CUETPlus Expert Review of Your Counselling Success.Counselling Assessment – Expert Guidance for Your CUET Journey