CUET Mock Analysis: How Students Track Progress & Improve Scores
Table of Contents
Introduction
Studying hard is not enough to succeed on the CUET; students now must study smarter as well. The increasing number of applicants for CUET each subsequent year means that students now require constant direction, constructive feedback, and data-driven recommendations for success. The CUET Mock Analysis has become an invaluable tool in this process.
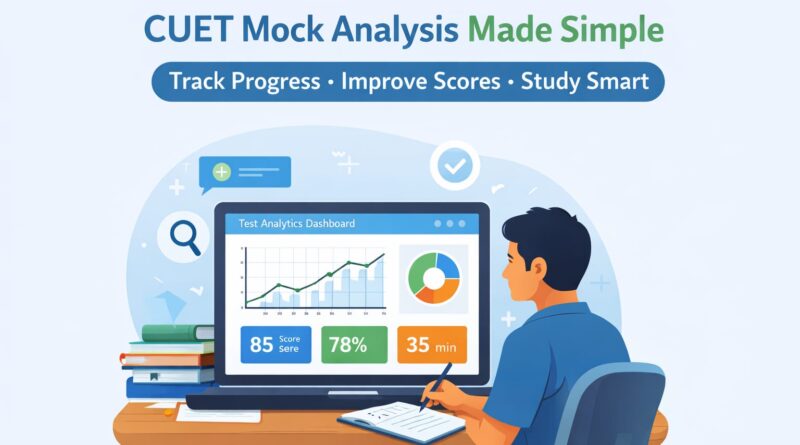
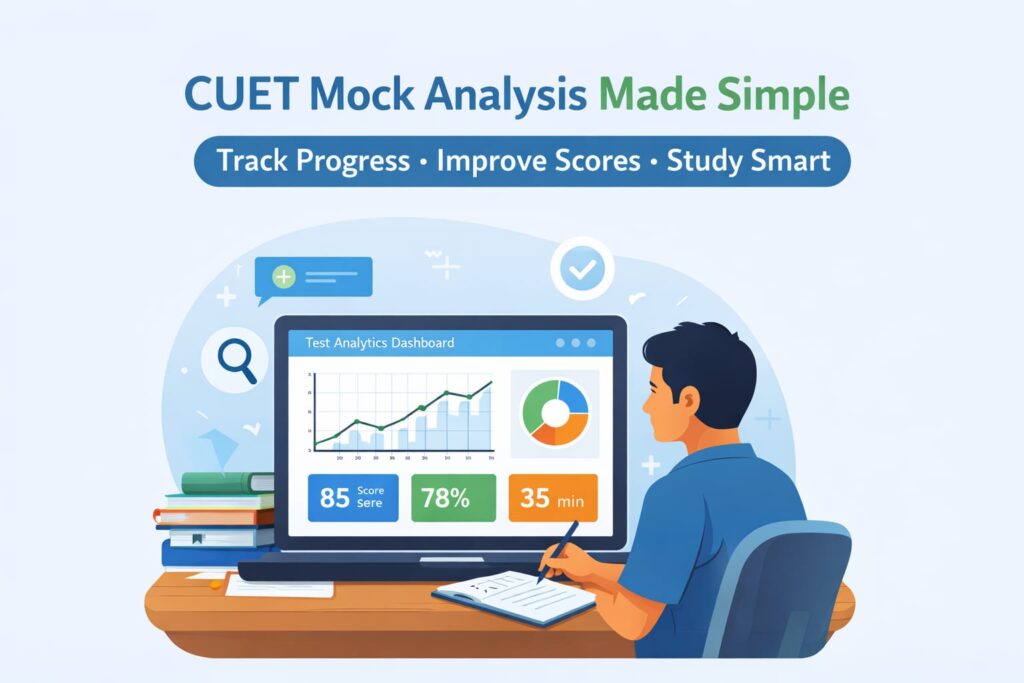
Throughout the last several years, CUET Plus has witnessed first-hand how receiving analytical data has enhanced the rate of improvement, motivation and consistent CUET score improvements for the students utilising analytical services, we will discuss, in layman’s terms, how tracking their progress with their Test Analytics Dashboard and following the steps outlined in the CUET mock analysis will assist students with getting closer to their ultimate goal of attending college or university.
Understanding the Importance of Progress Tracking During CUET Preparation
Many students prepare sincerely for the CUET, only to find themselves confused by the uncertainty of their studies. The three most commonly asked questions students ask themselves are:
- Am I making progress or merely studying more?
- Which subject requires additional focus?
- Why do I continue to score the same marks or grades on each mock test?
Due to the lack of effective progress tracking, many students find themselves relying on speculation. Progress Tracking through the Test Analytics Dashboard gives students clarity by converting mock test results into actionable insights. Rather than relying on vague impressions, students can readily see precise / quantitative data, trend analysis and areas of weakness through the use of the Test Analytics Dashboard to support their studies.
As the old adage states, what gets measured gets improved and therefore we at CUET Plus are huge supporters of analytical data generation.
What exactly does a Test Analytics Dashboard entail?
It’s a digital platform that collates the results derived from a student’s performance on mock tests and displays them in an easily digestible format. This dashboard provides much more insight than simply displaying scores.
What Are The Primary Functions of a Dashboard?
- It provides an accurate picture of the student’s real (as opposed to assumed) level of proficiency in each subject
- It highlights the student’s strengths and weaknesses
- It assists students with their daily and weekly study schedule
- It will ultimately lead to increased long-term improvement of a student’s CUET score
Utilizing CUET mock analysis dashboards gives students greater clarity and confidence during their preparation process.
Analytical Insights Provided by CUET Plus for Smart Preparation
CUET Plus has developed a Test Analytics Dashboard that mirrors the specific CUET examination patterns. This dashboard is easy to navigate, user-friendly, and sophisticated enough to allow aspiring students to maximize their efforts toward achieving their goal.
The Core Principles on Which Our Dashboard is Founded Include:
- The data should be presented in a format that is easy to interpret
- Insights from the data should provide actionable steps that will assist the student moving forward
- The student should have continuous visibility of his/her progress and be motivated by it
Rather than inundating students with massive amounts of data, the intention of the CUET Plus analytics dashboard is to help students select the best course of action after every mock test taken.
The Key Components of CUET’s Test Analytics Dashboard
Tracking a Student’s Subject-by-Subject Performance
One of the primary benefits of utilizing analytics as part of a student’s study process is that it provides clear information on how well a student is doing at the subject level.
Benefits of Subject-by-Subject Performance Tracking:
- Displays the student’s total score on each of the CUET Subjects
- Compares the student’s performance in each Subject
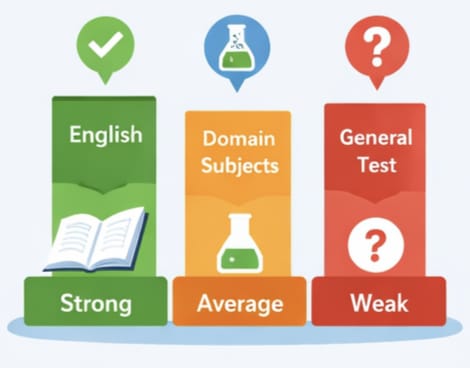
- Identifies strong and weak performance areas for the student
For example, a student may score well in English but struggle in General Test. Subject-wise CUET mock analysis ensures focused improvement instead of random revision.
Chapter & Topic Level Analysis
Studying the complete subject matter without identifying the chapters that are lacking is inefficient and does not make good use of your time.
The Dashboard Provides
- Chapter accuracy level
- Topic time spent
- Topicals that have repeat mistakes
The micro level analytics allows students to focus their time on only the chapters that need improvement and will help in your CUET score improvement.
Accuracy vs Attempts Breakdown
Many students enrolled in CUET will attempt too many questions incorrectly, resulting in wasted attempts.
Dashboard Provides
- Total questions attempted
- Correct vs. incorrect answers
- Negative marking
When students observe their own data, they will have a better understanding of which questions to attempt safely and which ones to skip, ultimately increasing their chances for success in CUET.
Time Management Insights: The Hidden Scorer
Time management is one of the least emphasized aspects of all CUET students.
How Analytics Improves Speed
- Displays time taken per question
- Identifies question types that consume the most time
- Comparing applicant’s speed vs. applicant’s speed at the time of taking exam
CUET students will gradually build the ability to balance speed vs. accuracy by utilizing regular CUET mock analysis. This analysis will assist them to make small improvements over time, which will ultimately help them achieve a higher score on the CUET.
Tracking Rank & Percentile
Marks alone do not provide the complete picture of the competition when sitting for the CUET exam.
Importance of Rank
- The first indication of actual competition level
- Demonstration of the student’s objectives
- Measure of improvement in relationship to all other students that sat for the CUET
With CUET Plus Analytics, you will receive your rank and percentile with each mock test and you’ll have an unexpected level of understanding of where you are in comparison to other CUET applicants.
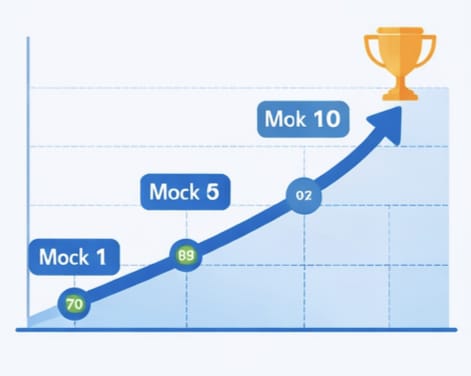
Performance Trend Analysis Over Time
One test means nothing, consistency is what determines success.
What Trends Indicate
- Improvement or decline over all
- Individual Progress for each subject’s performance
- Impact of revision strategy
All on the Visual Performance Graph conveys a motivation for the student. It shows how minor improvements in each section will help in your CUET score improvement.
Analyzing Errors and Mistakes
Mistakes provide great learning opportunities if they are analysed appropriately.
There are Many Kinds of Errors
- Conceptual Errors
- Errors Involving Calculations
- Errors Brought on by Time Constraints
- Making Guesses
CUET Plus strongly concentrates on the error-based CUET Mock analysis help students not repeat any previous errors.
Personalizing a Study Plan with Analytics
There is not a ‘one-size-fits-all’ approach when preparing for CUET.
Steps Involved in Personalisation
- Provides Focus Areas for Students
- Provides a List of Revision Priorities
- Provides Levels of Difficulty
CUET Plus mentors work with students using Dashboard insights to create a personalised strategy to CUET score improvement.
How Students Apply Analytics After Mock Tests
Mock Test Purchasing or Registering Will Only be of Limited Value Without the Following Activities.
Steps to be Considered after Completing a Mock Test
- Review Individual Scores by Subject
- Study the questions that the student had Incorrect Responses
- Calculate the Time Spent on Each Section
- Identify which Chapters are Weaknesses
- Use the Data Collected to Prepare the Next Study Plan
The above method of studying and CUET Mock analysis is the differences between great performers and average students.
How Analytics Can Help Reduce Exam Stress
Stress is caused by uncertainty. Stress is reduced by having clarity.
Benefits of Analytics to Build Confidence
- Track your progress
- Have realistic expectations
- Be less afraid of surprises
Using a dashboard makes students feel more in control on exam day, so they are calm and confident.
How Analytics Will Help You in the Last 60 Days to Prepare for the CUET
The last part of preparing for the CUET is the most important. This is the most stressful part of preparing for the CUET.
The Smart Way to Use Your Dashboard in the Last 60 Days
- Only focus on the highest impact topics.
- Don’t waste time learning new topics.
- Increase your accuracy and speed.
CUET Plus’ analytics help students further enhance their preparation and maximize CUET score improvement in a short period of time.
Learning by Comparison with Analytics
Students are inspired by seeing how topper perform.Not only is it inspirational to a student,
- To know what the best attempt strategy is
- Time per section
- How accurate they should try to be
Therefore, using the comparative CUET mock analysis allows students to adopt better patterns in their Exam Preparation.
Analytics for Domain Subjects vs. General Test
Different strategies are needed for the different sections of the CUET.
Dashboard Customization
- Domain subjects: Focus on concept accuracy.
- English: Speed & Comprehension.
- General Test: Practice & elimination techniques.
The CUET Plus dashboard clearly depicts these differences, allowing students to better prepare for the tests.
Data-Driven Motivation to Stay Consistent
A student’s motivation decreases when his or her efforts go unseen.
Analytics as a Source of Motivation for Students
- Displays visual representations of their progress toward improvement
- Track Milestones as they accomplish them
- Provide insights that Help Students Build Confidence by Seeing
Seeing even small gains in CUET score improvement keeps students consistent and focused.
Parents’ Role: Transparent Progress Tracking
Many parents are concerned about how much their child is prepared.
Why Analytics Affects Parents
- Clarity of performance report.
- No guessing or false confidence
- Indicators of real improvement
Analytics of CUET Plus make it easy for students, parents, and mentors to see how well their preparation works for them.
How CUET Plus Fuses Mentoring with Analytics
While data alone can be a powerful resource, the guidance you receive from a mentor maximizes its effectiveness.
Benefits of CUET Plus
- Expert analysis of the student’s analytics.
- Personal feedback sessions with the mentor.
- Action plans available for the student.
The combination of all these resources and CUET mock analysis help students effectively demonstrate the power of analytics in CUET score improvement.
Common Misconceptions by Students
All tools (including CUET Plus) have their best and worst purposes, and students can easily misinterpret the analytics’ implications.
Things Students Should NOT Do
- Become preoccupied with one bad mock result.
- Disregard past performance data trends.
- Never change or modify one’s errors.
- Blindly compare themselves with the toppers.
CUET Plus educates students to use their analytics for maximum benefit and in the most positive way.
The Data-Driven Roadmap
The majority of CUET students begin their studies confused about what data means to them. Data clarity develops through the analysis of trends over time.
How Analytic Data can Create Transformation
- Increased awareness of one’s strengths.
- Awareness and definition of one’s weaknesses.
- A Plan for The Study-Effective study plan.
- Improve the exam preparation mindset through increased confidence.
The entire premise of CUET Plus preparation is based on this idea.
Analytics are the Future of CUET Preparation
Current trends in CUET preparation methods continue to evolve.
Why Analytics Will Be the Future of CUET Preparations
- Objectively track performance
- Personalized learning path for each student
- Faster and smarter improvements
Students who adopt CUET mock analysis early gain a clear edge in CUET score improvement.
Building Confidence on Exam Day with Regular Mock Analysis
The Clarity that Comes from Having No Questions About Your Preparation
Many students who take the CUET exam put in a lot of effort but are left wondering if they are prepared enough. By consistently performing CUET mock analyses, students can clearly see where they are and how well they are performing after each test.
- Clarity in Subject-specific Performance
- Visibility of Areas for Improvement
- Reduced Anxiety and Stress on Exam Day
Having the clarity that comes from science-based data about performance will help build confidence on exam day.
Trust in Your Preparation is Built by Consistent Performance Data
As students view data supporting their efforts, they build confidence in their prep. The Test Analytics Dashboard shows how a student can lead to long-term CUET score improvement.
- Increase in Accuracy Percentage
- Fewer Errors Repeated
- Create Stability in Scores Across Mock Tests
At CUET Plus we help students develop trust in their prep by having data to prove their efforts.
The Patterns of Student Performance Are Predictable
CUET Mock Analysis Repeatedly allows us to see the predictable trends of student performance. The predictability decreases the anxiety surrounding the actual exam.
- Safe Attempt Numbers
- Strong Areas vs Dangerous Areas
- Order of Solving Questions
CUET students find the exam to be much less daunting when they understand what to anticipate.
The Tools Utilized to Manage Stressful Moments More Effectively
The Test Analytics Data prepares the students for stressful situations as a result of possible time delay issues or errors due to lack of focus. By reviewing the errors and drop in accuracy that occur during time-sensitive questions, the students learn how to maintain focus even during challenging parts of the exam.
- Improved Time Management
- Fewer Errors Due to Negative Marks
- Better Strategies on How to Skip Questions
By learning these skills from Mock CUET Analysis, students will see a substantial increase in their CUET scores.
Confidence Based on The Data for Test Day
Confidence is not produced by motivation; confidence is produced by the facts. The CUET Test Analytics Dashboard clearly provides the students with their Level of Preparedness.
- Graphs Showing Growth Over Time
- Trends Showing Improvement
- Mental Reinforcement of the Results
Through continuous CUET Mock Analysis, students will enter the exam room with confidence, clarity, and full preparation.
Final Thoughts: Smart Analysis Leads to Better CUET Results
CUET preparation today is not just about studying more—it is about understanding your performance and improving it step by step. A Test Analytics Dashboard helps students prepare with clarity, focus, and confidence by turning mock test data into meaningful insights.
Regular CUET mock analysis removes guesswork from preparation. It shows students their real strengths, highlights weak areas, and guides smarter revision strategies. This structured approach saves time, reduces stress, and leads to consistent CUET score improvement.
At CUET Plus, analytics is an essential part of the learning process. Every mock test becomes a learning opportunity, helping students refine their strategy, improve accuracy, and manage time better. As progress becomes visible through data, confidence naturally grows.
In the end, success in CUET depends on how effectively students use their effort. With focused CUET mock analysis and a data-driven approach to CUET score improvement, CUET Plus students prepare smarter and perform with confidence on exam day.
Explore More: Choosing the Right CUET Coaching Matters
While test analytics helps students track performance and achieve steady CUET score improvement, choosing the right coaching institute is equally important at the start of preparation. The quality of guidance, study material, and mock test structure plays a major role in how effectively students use CUET mock analysis.
To help students make the right decision, CUET Plus has also published a detailed guide titled “How to Choose the Best CUET Coaching in Your City (Checklist 2026)”. This blog walks students through practical factors such as faculty quality, mock test systems, doubt-solving support, results transparency, and learning environment.
If you are still evaluating coaching options or want to understand what truly separates a good CUET institute from an average one, this checklist-based guide will give you clear direction. Reading it alongside this analytics-focused blog helps students build a strong foundation and then track progress effectively throughout their CUET journey.